ANR research project · 2024–2028
Wound-rPPG
Measurement of microvascular perfusion by remote photoplethysmography applied to wound monitoring
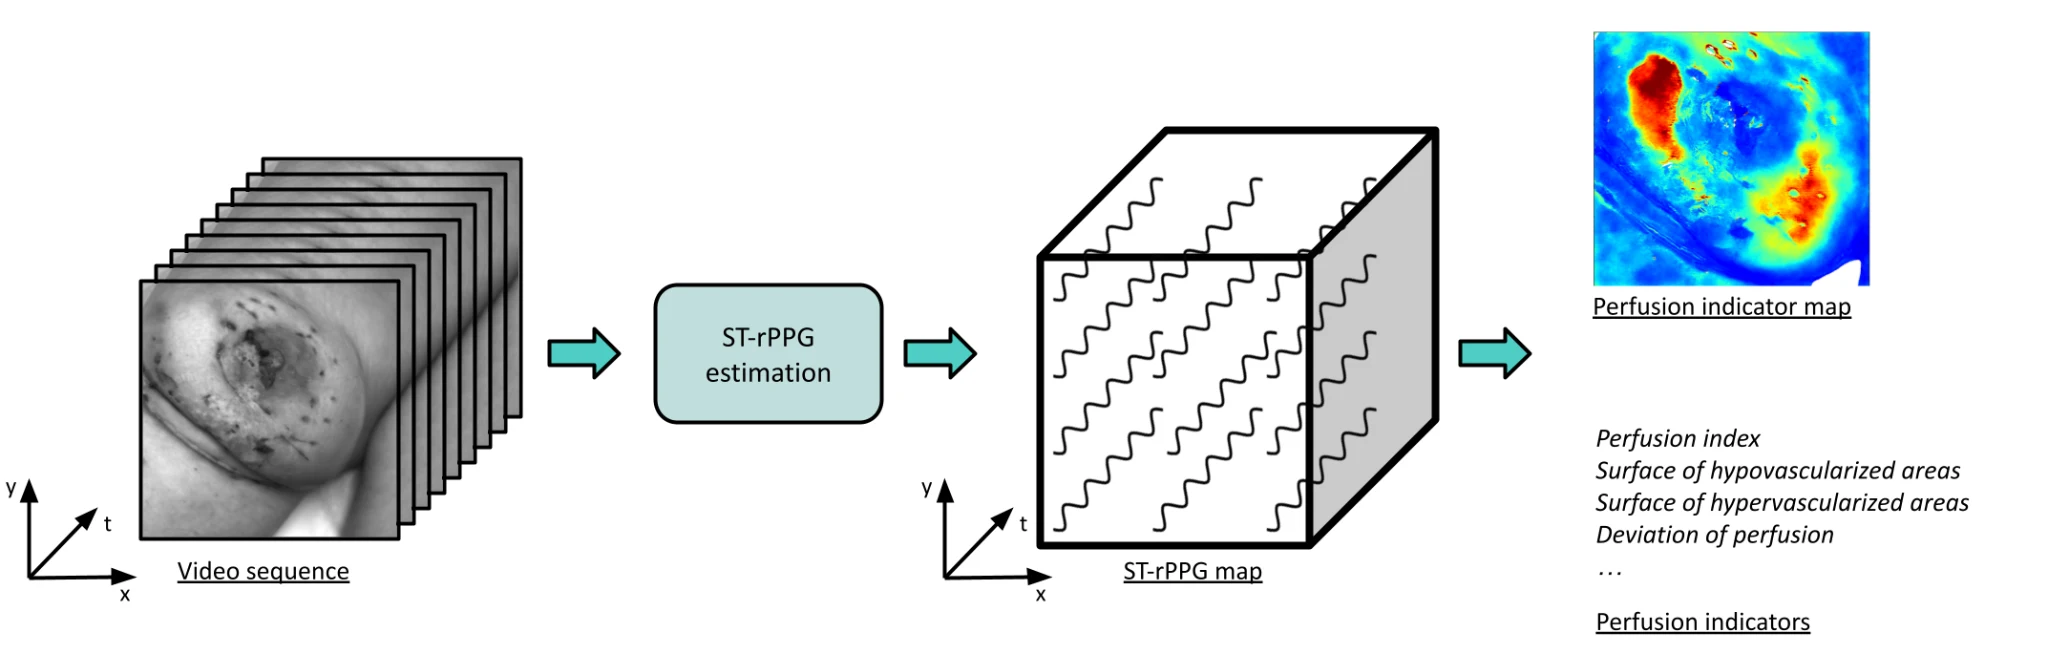
The microvascular perfusion is a key factor in wound healing, yet it is rarely measured in routine care. Wound-rPPG develops a contactless and affordable way to map it: a camera films the wound for a few seconds, and deep learning methods extract the tiny colour changes caused by each heartbeat, pixel by pixel. The resulting perfusion maps are evaluated with clinicians for wound characterisation and follow-up.

- 48 months · 2024 – 2028
- ANR collaborative research project (PRC), CE45 Mathematics, computer science and life sciences interfaces
- 3 partners: ImViA (Université Bourgogne Europe), LCOMS and LGIPM (Université de Lorraine), CHRU de Nancy
Context
Chronic and complex wounds, such as venous ulcers, pressure ulcers, burns or post-operative complications, affect 1.5 to 2 million people in Europe and account for 2 to 4 % of healthcare spending. Healing depends strongly on the blood supply to the wound and its surroundings (the peri-wound area): poor perfusion slows the formation of new tissue, whereas excessive perfusion may signal infection. Today, wound assessment remains mostly visual and manual, and perfusion imaging devices are expensive and seldom used.
Photoplethysmography (PPG) measures the variations in blood volume under the skin with light. It is the principle of the pulse oximeter clipped on a finger. Remote PPG (rPPG) does the same with a camera, without contact. Wound-rPPG goes one step further with spatially resolved rPPG (ST-rPPG), called camera-based perfusion imaging: instead of a single signal, a pulse signal is estimated at every pixel, giving a map of microvascular perfusion.
Scientific barriers
- The origin of the signal is still debated: the classical model attributes it to arterial blood volume changes, but experimental observations suggest that mechanical deformations of the skin also play a role.
- Deep learning outperforms hand-crafted methods for conventional rPPG, but training it for ST-rPPG is difficult: no reference measurement exists for each pixel.
- Perfusion maps must be turned into simple, reliable indicators that clinicians can use.
Objectives
- Better understand how ST-rPPG signals form in the skin, through numerical simulation of light–tissue interaction and experiments.
- Develop deep learning models that estimate ST-rPPG maps from videos, trained with synthetic data and advanced learning paradigms.
- Validate ST-rPPG maps and perfusion indicators for wound characterisation and follow-up in a clinical setting.
Methodology
- WP1 - From numerical simulation to experimental studies
- A multispectral acquisition system records videos of the skin at several wavelengths. Spatio-temporal Monte Carlo simulations of light propagation in healthy skin and wounds are developed and compared with experimental data, to study the origin of the ST-rPPG signal.
- WP2 - Deep learning models for ST-rPPG estimation
- A library of reference (non deep learning) methods serves as a baseline. Synthetic videos of healthy skin and wounds, with controlled pulse signals and motion, are generated to train deep neural networks; semi- and weakly-supervised learning then adapt them to real videos.
- WP3 - Clinical validation for wound characterisation
- A dedicated acquisition prototype, with uniform lighting and cross-polarisation, is used to record videos of wounds during routine follow-up visits. The aim is to identify the perfusion indicators most useful for clinical decision-making and to assess their value for predicting healing.
Clinical study
A prospective, observational study is being set up at the CHRU de Nancy, with three types of wounds: post-operative wounds, venous ulcers and burns. Short video acquisitions are made during the usual follow-up visits, without any change to patient care.
Consortium
- IMVIA
- Imaging and Artificial Vision laboratory (UR 7535), Université Bourgogne Europe, Dijon - project coordination, acquisition systems, simulation, reference methods, deep learning.
- LCOMS and LGIPM
- Laboratory of Design, Optimisation and Modelling of Systems (LCOMS) and Laboratory of Computer Engineering, Production and Maintenance (LGIPM), Université de Lorraine - signal processing and deep learning for physiological measurement.
- CHRU de Nancy
- Regional University Hospital of Nancy - clinical expertise in wound healing and reconstructive surgery, clinical study.
- Yannick Benezeth
IMVIA · Project coordinator - Johel Mitéran
IMVIA - Julien Dubois
IMVIA - Franck Marzani
IMVIA - Matthieu Rossé
IMVIA - Thomas Boussey
IMVIA - Frédéric Bousefsaf
LCOMS · WP2 leader - Choubeila Maaoui
LGIPM - Franck Duteille
CHRU de Nancy · WP3 leader
PhD students and engineers: Jean Marin (IMVIA, Monte Carlo simulation of the skin), Ahmad Hmedeh (LCOMS, synthetic data generation), Joffrey Michaud (IMVIA, deep learning for perfusion maps), Arnaud Curie (IMVIA, research engineer, software for the reference methods).





Publications
The list of articles and conference papers of the project is on the Publications page.
Contact
Yannick Benezeth, project coordinator - IMVIA, Université Bourgogne Europe, Dijon.
yannick.benezeth@u-bourgogne.fr